
Page 576 - ProShow Producer 9 Final Manual
P. 576
575 575
• Interpolated Value Yellow): the yellow line is only available in a
few cases. This line only applies when you are working with a
modifier applied to a specific keyframe, and the adjacent
keyframes have their own modifiers. When this happens, the
yellow line shows you how the current and neighboring modifiers
will interact and what the result will be. A very simplified way to
think of this is that the yellow line represents the transition
between modifiers. Unless you are dealing with specific
keyframes, this line is disabled. The keyboard shortcut to peek is
CTRL+ALT.
Let’s consider another simple example using a modifier applied to the
Zoom Y value. You might want to work along with this one to better
understand what’s being done:
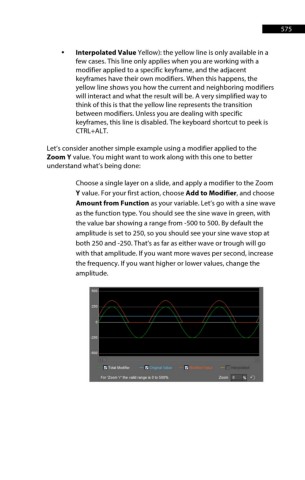
Choose a single layer on a slide, and apply a modifier to the Zoom
Y value. For your first action, choose Add to Modifier, and choose
Amount from Function as your variable. Let’s go with a sine wave
as the function type. You should see the sine wave in green, with
the value bar showing a range from -500 to 500. By default the
amplitude is set to 250, so you should see your sine wave stop at
both 250 and -250. That’s as far as either wave or trough will go
with that amplitude. If you want more waves per second, increase
the frequency. If you want higher or lower values, change the
amplitude.